The 5 Numbers That Actually Matter This Month


Your financial advisor sends you a quarterly letter. Your 401(k) sends you a statement. Neither one tells you what's actually happening. Here are the 5 numbers that matter right now — and what each one means for your money.
You don't need a Bloomberg terminal. You don't need CNBC on in the background. You need five numbers, updated once a month, translated into English.
This is that list.
1. Gold: $4,490/oz — down 17% from the January high
Gold hit $5,405 in January. It's since pulled back to around $4,490. If you've been watching from the sidelines, you're wondering if you missed it.
You didn't.
In the 1970s, gold rose 2,400% over about 10 years. In the 2000s, it rose 630% over about the same span. The current bull market — which started in late 2022 — is up roughly 175% in three and a half years. By historical standards, this isn't late innings. An analysis from MKS PAMP described the current cycle as "mid-cycle, not late stage."
Meanwhile, the buyers aren't slowing down. Central banks purchased 244 tonnes of gold in Q1 2026 alone — the strongest first quarter on record. Poland added 31 tonnes. China is on its 16th consecutive month of buying. Malaysia bought gold for the first time since 2018. South Korea for the first time since 2013.
What to do: If you own gold, hold. If you don't, a 17% pullback in a mid-cycle bull market is what an entry looks like. GLD is the simplest vehicle.
2. Money Market Funds: $7.77 Trillion
That's the current balance sitting in US money market funds as of May 20th, according to the Investment Company Institute. It went up another $16.9 billion in a single week. $3.09 trillion of that is retail — your neighbor, your dentist, your aunt who sold her house and parked the cash.
Here's the math nobody does: a 4.8% money market yield minus 25% tax leaves you with 3.6%. If the real cost of living — groceries, insurance, property taxes — is rising at 5-7%, you're losing 1.4-3.4% of purchasing power per year. On $600,000, that could mean $8,000 to $20,000 in invisible annual losses, depending on your actual household inflation rate.
The account statement shows green. Your purchasing power is red.
What to do: Run the math on your own balance. If real inflation on the things you actually buy exceeds your after-tax yield — and it almost certainly does — consider moving 10-15% into real assets.
3. Copper Deficit: 150,000 Tonnes (Projected 2026)
The International Copper Study Group projects the global copper market will flip from surplus to a 150,000-tonne deficit this year. ING's model puts it at 600,000 tonnes. Mine production growth has slowed to just 1.4% — the lowest in years.
Why it matters: every electric vehicle needs roughly 180 pounds of copper. Every wind turbine needs several thousand pounds. Every data center, every transformer, every substation, every solar installation. And new mines take 7-10 years from discovery to production.
The demand is locked in by signed contracts and government mandates. The supply takes a decade to respond. The math doesn't balance.
What to do: COPX (Global X Copper Miners ETF) or FCX (Freeport-McMoRan) for direct exposure. This is a structural squeeze, not a trade.
4. The Uranium Countdown: 583 Days
On January 1, 2028, the last waiver allowing Russian uranium into the United States expires. No extensions. No exceptions. Full ban.
Russia controlled roughly 44% of the world's uranium enrichment capacity. The US depended on Russia for 20-30% of its enriched uranium. Congress allocated $2.7 billion to rebuild domestic enrichment — but new facilities take 5-7 years. We're inside the gap.
In January, Meta signed deals with Bill Gates' TerraPower and Sam Altman's Oklo for 4 gigawatts of nuclear power. Microsoft backed the Three Mile Island restart. Every hyperscaler needs 24/7 power for AI data centers, and the only carbon-free option at that scale is nuclear. Nuclear needs uranium. The supply is shrinking against a hard deadline.
What to do: URNM (Sprott Uranium Miners ETF) or CCJ (Cameco) for exposure. The catalyst has a date on the calendar — January 1, 2028.
5. Grid Blackout Risk: 100x by 2030
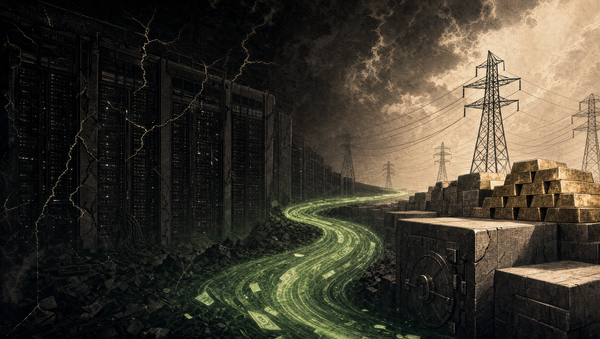
The US Department of Energy released a report in July 2025 that should have been front-page news. Their finding: blackout frequency in America could increase by up to 100 times by 2030 if current trends continue.
The numbers behind it: 104 GW of firm power generation is expected to retire by 2030. Of 154 GW of new projects in development, only 19 GW can provide reliable around-the-clock power. Physical attacks on grid infrastructure doubled in 2024 — 220 incidents in the Western Interconnection alone. Cyberattacks on utilities rose 70% year-over-year. And 70% of US power transformers and transmission lines are over 25 years old.
The DOE just announced $1.9 billion in SPARK funding to begin grid hardening. They know.
What to do: Eaton Corp (ETN) builds the electrical components. Quanta Services (PWR) is the largest grid contractor in North America. Vistra (VST) and Constellation (CEG) run the power plants. These companies get paid from both the government rebuild and the Big Tech power race.
The Big Picture
Five numbers. Five minutes. You now know more about what's happening to your money than most financial advisors will tell you this quarter.
The pattern connecting all five: real, physical things — gold, copper, uranium, electricity — are becoming scarcer and more valuable. Paper assets and cash substitutes are losing ground to the real world. The central banks see it. The billionaires see it. The US government's own data confirms it.
The question is what you do about it.
We'll update these five numbers next month. If you want the specific tickers, entry zones, position sizes, and kill criteria for each of these themes — that's what the Black Out Fortune Playbook was built for.
This is what we do inside EnergyMacro. Real assets. Real data. No jargon. If you want the full playbook, it's here.
— @RealAssetRebel
Disclaimer: EnergyMacro Research provides financial commentary for educational purposes. Nothing in this publication constitutes personalized investment advice. All investments carry risk, including the potential loss of principal. The tickers mentioned are for informational purposes — always do your own due diligence and consult a qualified financial advisor before making investment decisions. Past performance is not indicative of future results.