The Gold/Silver Ratio Just Hit 66 — Here's What Comes Next

Energy Macro Deep Dive — February 19, 2026
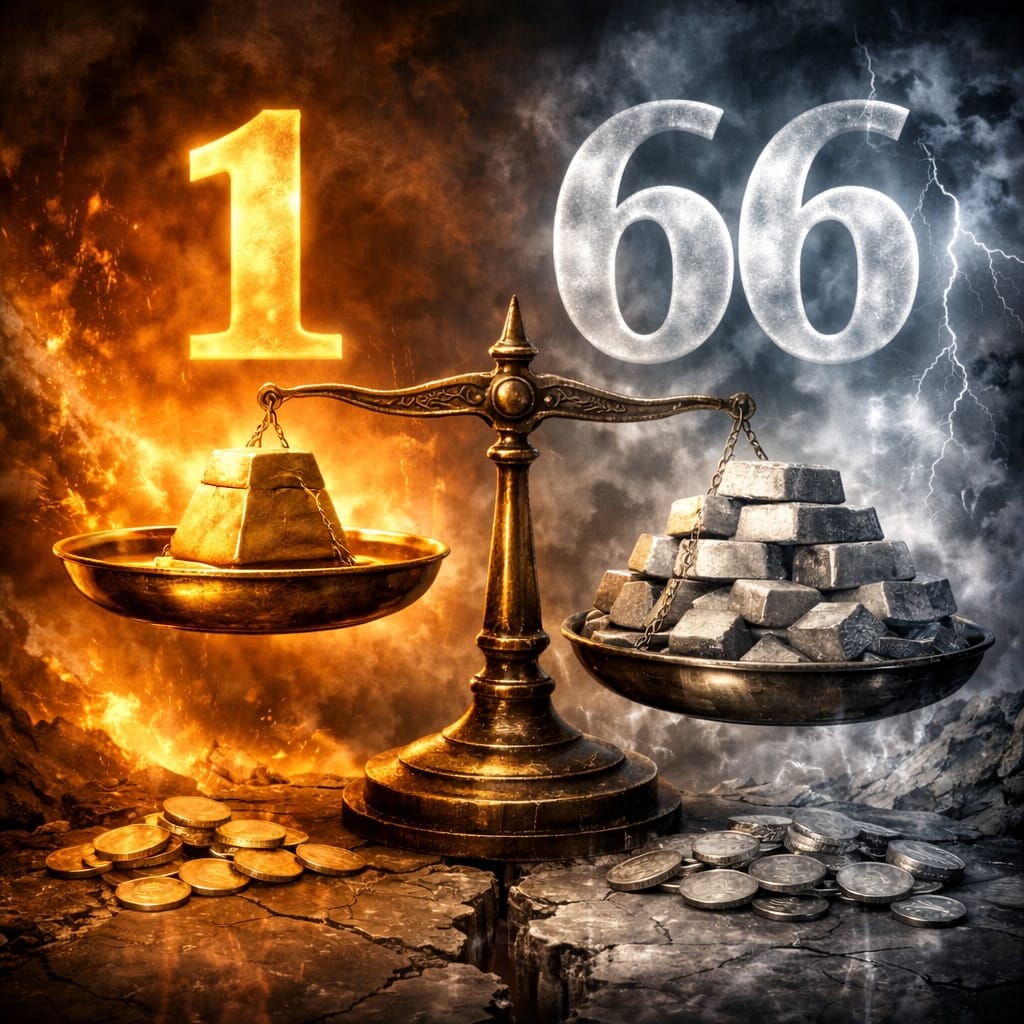
Silver just got obliterated. Down 15.77% in a single session while gold barely budged, pushing the gold/silver ratio to 66.27 — its highest level since the March 2020 panic.
When silver crashes this hard against gold, it's not just a precious metals story. It's a macro regime shift playing out in real time, and it has massive implications for every real asset investor over the next 12 months.
The Ratio That Tells the Future
The gold/silver ratio — simply gold price divided by silver price — is one of the most reliable leading indicators in commodity markets. Right now, it's saying the economic soft landing narrative just died.
Here's the historical playbook: When the ratio spikes above 80, recession is either here or coming within 6 months. When it falls below 50, industrial demand is roaring and inflation is accelerating. At 66.27 today, we're in the danger zone where financial stress starts overwhelming industrial optimism.
Consider the recent moves. Silver hit $79.18 just yesterday before cratering to $66.69 — a $12.49 swing that represents real money flowing out of industrial metals and into monetary safe havens. Meanwhile, gold held remarkably steady, gaining 0.14% to $4,896.20 per ounce.
This divergence isn't random. Silver is 60% industrial demand (electronics, solar panels, EVs) and 40% monetary demand. Gold is 90% monetary. When silver gets crushed relative to gold, it's the market pricing in collapsing industrial activity ahead.
Why the Ratio Spiked Now
Three catalysts converged this week to trigger the silver selloff:
First, China's manufacturing PMI came in at 47.2 vs. 49.1 expected — the lowest reading since late 2022. China consumes 15% of global silver, mostly for electronics and solar installations. When Chinese factories slow down, silver demand craters immediately.
Second, the dollar surged. The DXY (via UUP) gained 0.30% today to 27.09, its highest level in 8 weeks. Silver is priced in dollars and held mostly by non-US investors, making it hypersensitive to dollar strength. Every 1% DXY rally historically correlates with a 2.5% silver decline.
Third, treasury yields spiked. The 10-year hit 4.079%, up 67 basis points, making yield-free metals less attractive. TLT gained 1.09% today, but that's a relief bounce after getting hammered. The underlying message: real rates are rising, crushing non-yielding assets.
The 12-Month Roadmap
History says the gold/silver ratio leads economic cycles by 3-6 months. Here's what the current 66+ reading implies:
Q2 2026: Industrial recession begins. Copper (down 6.12% via COPX today) confirms this message. Industrial metals are pricing in a synchronized global slowdown that starts with China and spreads to Europe and North America by summer.
Q3 2026: Central banks pivot. When the ratio hits 75-80 — which it will if this trend continues — it historically coincides with the Fed's first emergency rate cut. The bond market is already positioning: TLT's 1.09% gain today suggests smart money is rotating into duration ahead of the pivot.
Q4 2026: The ratio reverses violently. Once central banks capitulate and flood the system with liquidity, silver rebounds 2-3x faster than gold. The ratio typically collapses from 80+ to 50- within 6 months of the first rate cut.
2027: Real assets roar back. Post-crisis monetary expansion drives the next commodity supercycle. Silver hits new all-time highs. Industrial metals follow. Energy infrastructure assets (the core of our thesis) become the ultimate hedge against currency debasement.
The Investment Angle
This setup creates a clear 3-phase playbook:
Phase 1 (Now - Q2): Defense. The gold/silver ratio above 65 says stay defensive. Hold gold (GLD up marginally today while everything else bleeds). Avoid silver miners like SILJ (down 8.69%) until the ratio peaks. Cash and short-duration bonds outperform.
Phase 2 (Q3): Transition. Watch for the ratio to peak around 80. That's your signal to start accumulating silver and industrial metals at generational lows. COPX at 81.31 today will look cheap at the cycle trough.
Phase 3 (Q4-2027): Offense. When the ratio breaks below 60 on the way down, back up the truck. Silver miners historically return 300%+ in the first year after the ratio peaks. Industrial real assets — copper mines, uranium (URNM), energy infrastructure — become the decade's best trades.
The uranium sector provides the perfect example. URNM down 6.19% today to $65.72, but uranium demand is structural and supply is constrained. When the macro headwinds reverse, uranium mining stocks typically lead the real asset recovery.
The Bottom Line
The gold/silver ratio at 66+ is screaming that industrial recession comes before monetary expansion. Silver's 15.77% crash today isn't just a bad day — it's the market pricing in 6-9 months of economic pain ahead. But that pain creates the setup for the next great real asset bull market, probably starting in Q4 2026 when central banks capitulate and the ratio violently reverses.
This is part of Energy Macro's weekly research. For the full model portfolio and real-time alerts, see The Weekly Wire.
Data sources: Bloomberg, Federal Reserve Economic Data, London Metals Exchange, Shanghai Futures Exchange


